For what it’s worth, Boston rent prices haven’t always been absurd.
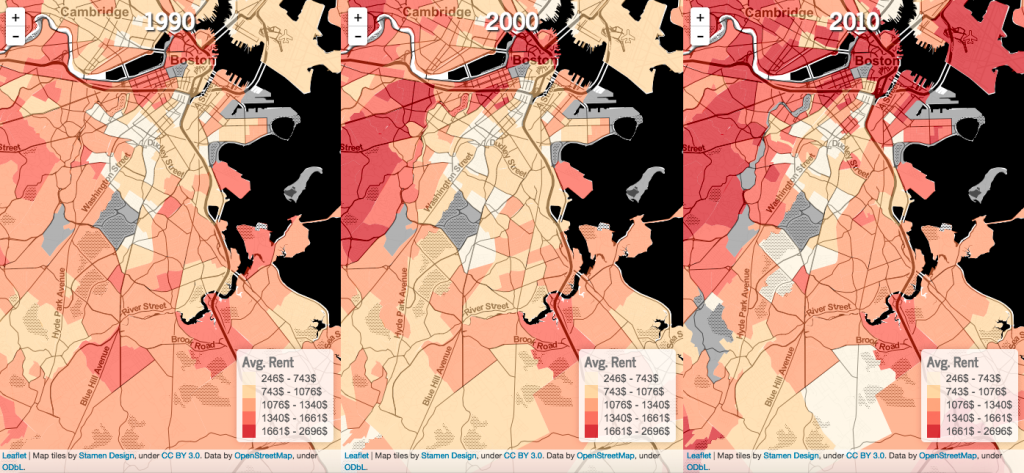
No. Instead, the above maps illustrate that it took two decades for Boston rents to climb into the unaffordable range.
In short: the year was 1990, and rents were reasonable. Then, suddenly, higher prices invaded from the west. By 2000, the average rent in historically pricey neighborhoods – downtown, Beacon Hill, the North End, etc. – had ballooned from somewhere in the range of $1,340 and $1,661 a month to the $1,661 to $2,696 range. And by 2010, the Red Army (a.k.a. steep rents) had breached the Fort Point Channel and crossed the Boston Harbor, overwhelming the Southie and Eastie rental markets.
The maps were published by Ungentry, a group of volunteers – “developers, designers, data geeks and citizen activists” – who use creative tech to tackle civic and social problems. A branch of Code for America, Ungentry is focused on the impact rapid gentrification is having on the cost of living in cities like San Francisco.
Now the volunteer group wants to know: “Is Boston susceptible? Is it possible that a booming tech industry is contributing to this process? How can we contribute to a policy discussion?”
Ungentry used data from the American Community Survey and The Boston Foundation/MAPC Data Common to examine gentrified neighborhoods “and establish a baseline of data that gives a rich picture of how the neighborhood has changed over time.”
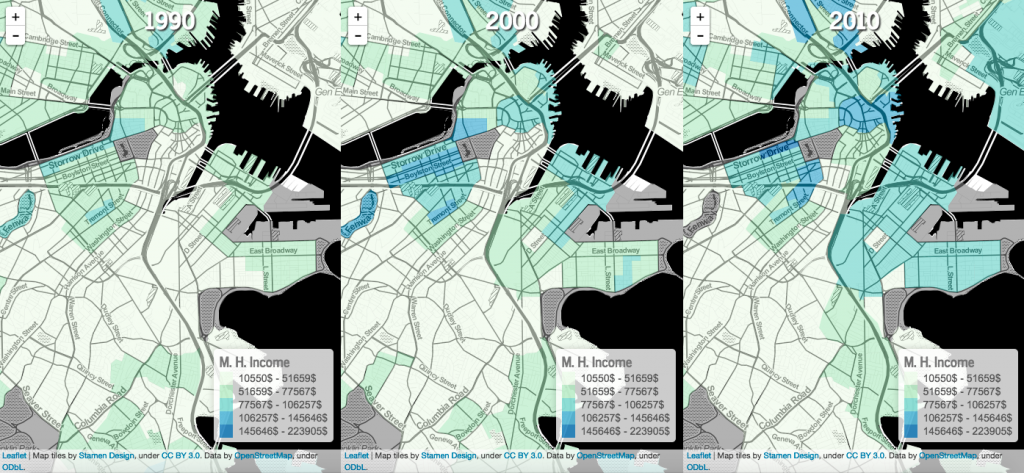
Based on the pattern that’s evident in the 1990, 2000, and 2010 maps, it appears, by 2020, rents in Dorchester, Mattapan, and Hyde Park could be as steep as what they are now in South Boston. If that’s the case, it will be interesting to see whether the median household income will be able to keep pace. Although by 2010 those neighborhoods – especially parts of Dorchester – had started becoming more expensive for renters, household incomes remained consistently low.

—
Author’s note: The original version of this story misspelled Ungentry. Sorry for any confusion. The post has been updated.
